A Delicate Frontier: Human Microglia Focus of Attention at Keystone
Quick Links
For a pesky cell type that comprises a small fraction of cells in the brain, microglia have an outsize impact on neurodegeneration. Many of the Alzheimer’s risk loci identified in genome-wide association studies harbor genes expressed in microglia, which seem to put their stamp on every stage of disease. Alas, their limited numbers and hot temper make microglia difficult to work with, especially the human kind, which must be plucked from postmortem brain samples. Despite these challenges, researchers presented new data on human microglia at the joint Keystone symposia—Advances in Neurodegenerative Disease Research and Therapy; and New Frontiers in Neuroinflammation: What Happens When CNS and Periphery Meet?— held June 17–21 in Keystone, Colorado. They tied the origin of AD risk more closely to microglia, wielding single-cell transcriptomics to uncover a striking degree of heterogeneity among microglia, and charting webs of microglial genetic networks that correlate with disease.
GWAS Hits: Pin the Blame on Microglia
At Keystone, Alison Goate of the Icahn School of Medicine at Mount Sinai, New York, aptly illustrated both the central role of microglia in disease, and the challenges of working with them. Goate had previously identified a polymorphism that reduced expression of PU.1, a microglial transcription factor that controls expression of many AD risk genes, including TREM2, TYROBP, CD33, the MS4A cluster, and ABCA7. The polymorphism delayed onset of AD, cementing the prominence of microglia in the disease process (Jun 2017 news). However, pinning the GWAS signal to SPI1, the gene encoding PU.1, was not a straightforward affair. As with the vast majority of GWAS hits, the polymorphism near the SPI1 gene resides in a noncoding region, meaning it could theoretically control expression of any nearby gene. To nab SPI1 as the gene responsible for the disease onset association, Goate and colleagues looked for expression quantitative trait loci (eQTL), i.e., genes whose expression was affected due to each polymorphism. Because microglial samples are too scarce to do a proper eQTL analysis, Goate resorted to the next best thing: She looked for eQTLs within the Cardiogenics Consortium, a set of gene-expression data from hundreds of monocyte and macrophage samples. This confirmed SPI1 as the most likely gene affected by the disease-onset-linked polymorphisms, at least in those related myeloid cells.
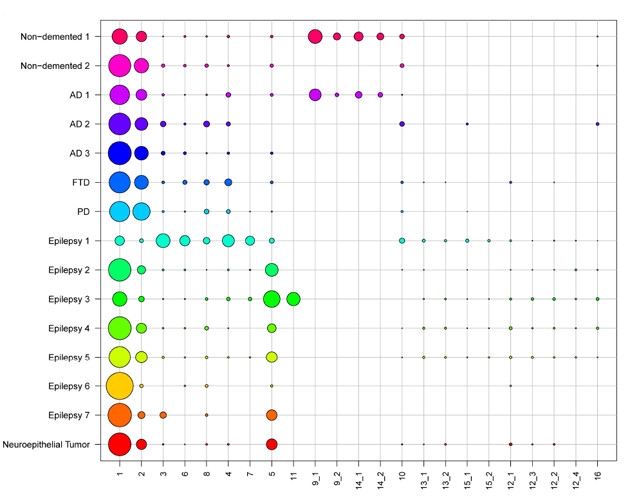
Gene Clusters. Single-cell RNA sequencing of postmortem and biopsy samples revealed 23 distinct gene-expression clusters among the cells, 14 of which expressed microglial markers. Circle size denotes proportion of the sample in each cluster. [Courtesy of Olah et al., bioRχiv, 2018.]
Goate then repeated this monocyte/macrophage eQTL analysis for more than 20 other GWAS loci. She added in a batch of new hits unveiled by a recent GWAS that counted people with “AD-by-proxy,” or family history of AD, as cases to beef up numbers (Apr 2018 news). For some of the GWAS hits, this analysis produced an obvious winner: Expression of MS4A4A, MS4A6A, PILRA, and FCR1g, for example, all correlated with disease-associated polymorphisms much more than expression of any other surrounding gene.
Other analyses produced a less obvious leaning toward one gene or another, and expression of at least one gene—Ptk2b—correlated with the nearby disease variant in monocytes, but not in macrophages. Whether monocytes or macrophages are a better proxy for microglia is unclear, Goate said. There is also the distinct possibility that some of the GWAS hits influence disease through expression in myeloid cells outside of the brain.
Christopher Glass of the University of California, San Diego, commended Goate’s work. He told Alzforum that the lack of microglial samples for eQTL analysis is an ongoing problem in the field. Glass said that his lab has access to only 25 such precious samples. Not only are microglia sparse in the brain, the cells are notorious for transforming their gene-expression patterns at the flip of a switch, making their careful isolation of utmost importance, Glass told Alzforum. He would know this as well as anyone, as he recently described how microglial transcriptomes shift rapidly in response to a change of scene, such as being plated into a culture dish (Jul 2016 conference news; Jun 2017 news). At Keystone, the Goate and Glass labs hatched plans to join forces in collecting microglial samples to run eQTL analyses.
In the meantime, Glass used a different approach to address the problem. He teamed up with UCSD colleague Bing Ren, who pioneered a technique called PLAC-seq (proximity ligation-assisted CHIP-seq) to link genetic regulatory regions with the genes they control (Fang et al., 2016). In a nutshell, the researchers sorted microglia from postmortem samples, isolated their nuclei, cut the DNA inside them with restriction enzymes, then performed a ligation reaction to fuse fragments of DNA that were stuck together, i.e., that were presumably in the midst of a regulatory liaison. The researchers then sequenced the DNA couples to discern which gene a given enhancer was controlling. PLAC-seq is not the only technique to decipher long-range chromatin connections—others include Hi-C and CHIA-PET—but Ren designed PLAC-seq to improve sensitivity and detect longer-range connections than other techniques; this made it suitable for rare cells like microglia.
At Keystone, Glass reported that in microglia sorted from postmortem samples, PLAC-seq captured more than 44,000 DNA interactions, 70 percent of which contained promoter sequences. One example was Sall1. Glass had previously reported that this gene’s expression became drastically downregulated when microglia were moved from the brain to culture. Using other chromatin activity mapping methods, Glass had proposed a region some 400kb away from the gene as an enhancer of its expression. PLAC-seq confirmed this suspicion, as this enhancer region was found associated with the SALL1 promoter. This served as confirmation that the technique works.
What about AD GWAS hits in noncoding regulatory regions? In Glass’ lab, postdoc Inge Holtman and colleagues next used PLAC-seq to ask which genes, if any, were connected by polymorphism-containing regulatory regions. They focused on newly identified AD risk loci from a recently expanded GWAS by the International Genomics of Alzheimer’s Project (IGAP) (Apr 2018 news on Kunkle et al., 2018). Specifically, Glass reported that one significant polymorphism near the BIN1 gene indeed connected strongly with the BIN1 promoter. This corroborated other chromatin analyses, such as ATAC-seq, which suggested the region was an active enhancer in microglia.
Glass also used PLAC-seq to reveal that yet another GWAS hit, nearest the ECHD3 gene, did not primarily associate with ECHD3 but rather with a different nearby gene, USP6NL. Notably, while no function is known for ECHD3, USP6NL has a role in endocytosis. Glass said he plans to apply the PLAC-seq approach to more fully investigate other GWAS risk loci.
Glass also reported results of his lab’s efforts to further determine which cells harbor the disease risk associated with each GWAS hit. Lab member Alexi Nott sorted neuronal (NeuN+) or microglial (PU.1+) nuclei from freshly frozen postmortem brain tissue, and performed an ATAC-seq analysis to identify active enhancer regions. In the case of BIN1, Nott found that the enhancer region containing the risk SNP was active in nuclei from microglia, but not neurons. This indicated that the Alzheimer’s-associated variant likely controls BIN1 expression in microglia, Glass said.
During questions following his talk, Glass told the audience that he plans to compare neuronal versus microglial epigenetic landscapes in cells derived from people with neurodegenerative disease with those without. He will also compare enhancer activation in iPSC-derived neurons and microglia, he later told Alzforum. Oleg Butovsky of Brigham and Women’s Hospital in Boston asked whether Glass could isolate nuclei specifically from microglia that surround plaques. Glass said that currently, there are no reliable markers that would distinguish nuclei from distant and plaque-associated microglia.
In a data-packed talk, Philip De Jager of Columbia University in New York described his lab’s efforts to link microglial gene expression profiles to disease phenotypes. De Jager aims to identify networks of co-expressed genes that could drive disease, and pick out biological pathways ripe for therapeutic targeting. He uses postmortem brain samples from the Religious Orders Study and the Rush Memory and Aging Project (ROSMAP). To date, ROSMAP has amassed more than 600 samples. At Keystone, De Jager reported that for 225 of them, the researchers took stock of the proportion of activated microglia (PAM) as per the cells’ morphological characteristics. They found that in cortical, but not subcortical, regions, PAM correlated with AD phenotypes, such as Aβ plaque burden, tau tangle pathology, and rate of cognitive decline. Using a statistical analysis to estimate causal relationships between these factors, De Jager proposed that together, activated microglia and Aβ pathology lead to tau pathology, which leads to cognitive decline. The findings are posted on bioRχiv (Felsky et al., 2018).
Based on RNA-sequencing data from 541 samples of prefrontal cortices, De Jager also identified modules of co-expressed microglial genes that correlated with specific AD features. Of primary interest, De Jager reported at Keystone and on bioRχiv, was that expression of genes in one module, Module 5, correlated with the extent of tau pathology (Patrick et al., 2017). The module contained genes involved in activation of the immune response, and looking back at the PAM analysis, he also found that this same module tracked with how many microglia were activated. Overall, De Jager concluded that these findings strongly implicated microglial activation as a pivotal step in the pathogenesis of AD.
While most of De Jager’s analyses used unsorted tissue samples to construct genetic networks, he also presented the fruits of initial efforts to investigate individual microglia (Olah et al., 2018). The researchers sorted live microglia from seven fresh autopsy samples of dorsolateral prefrontal cortices, as well as two fresh samples of hippocampi and six samples of temporal neocortices from epilepsy surgeries. In all, the researchers sequenced RNA from nearly 16,000 individual cells, 97 percent of which were microglia. They found significant levels of more than 1,200 RNA transcripts, and used them to cluster microglia into subtypes based on their gene-expression patterns (see image above).
This generated 14 unique clusters of microglia. A majority of microglia across samples fell into clusters 1 or 2; the other 12 clusters were more variable, and some were only found in samples from a couple of people. This suggests that some of these microglial clusters might be specific to certain diseases or functions. While the researchers had too few samples to correlate microglial clusters with disease phenotypes, they did find that some clusters were enriched for AD risk factors.
When the scientists compared human microglial clusters to clusters identified in mouse studies, they found the human repertoire to be more nuanced. For example, regarding the disease-associated microglia (DAMs) reported by Ido Amit of the Weizmann Institute in Israel, De Jager found that disease-associated genes were spread out among multiple clusters of human microglia (Jun 2017 news). However, he did find that expression levels of P2YR12 and ApoE were diametrically opposed in the human cells, as reported in mouse studies (Sep 2017 news).
De Jager also uncovered commonalities with disease-stage-specific clusters of microglia reported by Li-Huei Tsai at the Massachusetts Institute of Technology in the p25 mouse model of inducible AD. Specifically, human microglial cluster 10 expressed genes involved in cell proliferation, as did a cluster of microglia that appeared early in disease in Tsai’s mouse model. In addition, a group of microglia expressing interferon response genes—found at a late stage of the AD mouse model—also appeared in a subset of the human samples.
A growing number of scientists believe that microglial research has to be done using human cells. Tsai jumped the mouse ship, as well. When asked how the different types of mouse microglia identified in her studies compared with those of others, she replied that at the end of the day, what matters is characterizing microglia in the human brain. To that end, her group performed single-cell RNA sequencing on a subset of ROSMAP samples—24 from controls, and 24 from people with high Aβ burden. Unlike De Jager, Tsai did not sort out microglia first, but rather performed a co-expression cluster analysis on nuclei derived from all cell types in each sample. This was by design, Tsai told Alzforum, as her goal was to investigate how all cell types in the brain changed in the face of disease. In all, she identified 20 distinct expression clusters among cells, assigning each to a specific cell type based on the complement of genes. Tsai reported that the number of clusters identified for each cell type roughly correlated with the abundance of that cell type in the brain. For example, she identified nine expression clusters among excitatory neurons, five clusters in inhibitory interneurons, and two clusters among oligodendrocytes, which made up an average of 50, 12.6, and 26 percent, respectively, of cells in the 48 samples. Only one cluster for astrocytes and one for microglia, which made up 5 and 2.8 percent of cells in the brain, respectively, emerged from the analysis, Tsai reported.
Tsai correlated expression clusters of excitatory neurons and oligodendrocytes with AD phenotypes. One cluster of each—ex1 and oli1—were highly represented in people with low or no Aβ burden, while another cluster of each cell type—ex2 and oli2—correlated strongly with high Aβ burden. Relative to ex1, ex2 highly expressed genes for synaptic signaling and excitability, and poorly expressed genes for mitochondrial function. For the oligodendrocyte clusters, oli2 cells expressed higher levels of genes involved in protein folding, stability, and translation, and lower levels of intracellular trafficking genes than did oli1. Notably, Tsai also found that across all samples, men had higher numbers of the “good” cells (ex1 and oli1) than women, while the women had an overrepresentation of “bad” ones (ex2 and oli2). Tsai wondered whether the proportions of these cells could somehow reflect a greater susceptibility to AD among women.
Tsai told Alzforum that she plans to more closely examine how different gene-expression clusters of interneurons—the third most abundant cell type that Tsai identified after excitatory neurons and oligodendrocytes—correlate with disease. To look specifically at microglia or astrocytes, different techniques, such as presorting the cells, might need to be used. Glass, who opts to sort out microglia prior to analysis, told Alzforum that the field is still on the steep part of the learning curve when it comes to single-cell transcriptomics and other gene-expression analyses, especially when used on sparse cells like human microglia. Despite the limitations of working with postmortem samples, the only way forward is to keep trying, he said.—Jessica Shugart
References
News Citations
- Microglial Master Regulator Tunes AD Risk Gene Expression, Age of Onset
- When a Microglia Is No Longer a Microglia
- What Makes a Microglia? Tales from the Transcriptome
- Hot DAM: Specific Microglia Engulf Plaques
- ApoE and Trem2 Flip a Microglial Switch in Neurodegenerative Disease
Paper Citations
- Fang R, Yu M, Li G, Chee S, Liu T, Schmitt AD, Ren B. Mapping of long-range chromatin interactions by proximity ligation-assisted ChIP-seq. Cell Res. 2016 Dec;26(12):1345-1348. Epub 2016 Nov 25 PubMed.
- Kunkle BW, Grenier-Boley B, Sims R, Bis JC, Naj AC, Boland A, Vronskaya M, van der Lee SJ, Amlie-Wolf A, Bellenguez C, Frizatti A, Chouraki V, Alzheimer's Disease Genetics Consortium (ADGC), European Alzheimer's Disease Initiative (EADI), Cohorts for Heart and Aging Research in Genomic Epidemiology Consortium (CHARGE), Genetic and Environmental Risk in Alzheimer's Disease Consortium (GERAD/PERADES), Schmidt H, Hakonarson H, Munger R, Schmidt, Farrer LA, Broeckhoven CV, O'Donovan MC, Destefano AL, Jones L, Haines JL, Deleuze JF, Owen MJ, Gudnason V, Mayeux RP, Escott-Price V, Psaty BM, Ruiz A, Ramirez A, Wang LS, van Duijn CM, Holmans PA, Seshadri S, Williams J, Amouyel P, Schellenberg GD, Lambert JC, Pericak-Vance MA. Meta-analysis of genetic association with diagnosed Alzheimer's disease identifies novel risk loci and implicates Abeta, Tau, immunity and lipid processing. bioRxiv. April 5, 2018. bioRxiv.
- Felsky D, Roostaei T, Nho K, Risacher SL, Bradshaw EM, Petyuk V, Schneider JA, Saykin A, Bennett DA, De Jager PL. Neuropathological correlates and genetic architecture of microglial activation in elderly human brain. Nat Commun. 2019 Jan 24;10(1):409. PubMed.
- Patrick E, Olah M, Taga M, Klein HU, Xu J, White CC, Felsky D, Agrawal S, Gaiteri C, Chibnik LB, Mostafavi S, Schneider JA, Bennett DA, Bradshaw EM, De Jager PL. A cortical immune network map identifies distinct microglial transcriptional programs associated with β-amyloid and Tau pathologies. Transl Psychiatry. 2021 Jan 14;11(1):50. PubMed.
- Olah M, Menon V, Habib N, Taga M, Yung C, Cimpean M, Khairalla A, Dionne D, Hopp S, Frosch MP, Hyman BT, Beach TG, Sarkis R, Cosgrove GR, Helgager J, Golden JA, Pennell PB, Schneider JA, Bennett DA, Regev A, Elyaman W, Bradshaw EM, De Jager PL. A single cell-based atlas of human microglial states reveals associations with neurological disorders and histopathological features of the aging brain. bioRχiv. June 11, 2018 BioRxiv.
Other Citations
Further Reading
No Available Further Reading
Annotate
To make an annotation you must Login or Register.
Comments
No Available Comments
Make a Comment
To make a comment you must login or register.