Move over, genome, transcriptome, proteome. The latest ome aims to map every metabolite linked to human health and disease. Metabolomics, although still a nascent field, offers hope for biomarkers and treatments in neurodegenerative disease. The field's current task is to standardize experimental procedures while scientists are pursuing pilot studies in Alzheimer’s, Parkinson’s, Huntington’s, and amyotrophic lateral sclerosis. As reporter Amber Dancediscovered, scientists are following up on hints of new molecules involved in these conditions without knowing just yet what most of these molecules are. The full import of these experiments will not be realized until biochemists name the pieces and figure out how they fit into the body's myriad metabolic and catabolic pathways. Read Dance's four-part exposé. [Image of Rima Kaddurah-Daouk courtesy of Wikimedia Commons.]
Metabolomics: The Fourth Great Ome
You could say biological researchers have been binging on omes this past decade. In February 2001, they finished off the human genome, then proceeded to gorge on the transcriptome and the proteome, not to mention the connectome, secretome, variome, et alia. The Big Three complete the central dogma of molecular biology: The genome encodes the transcriptome encodes the proteome. But that original triad misses some of the most important players in biology, that is, the small metabolites spewed out left and right in the body’s constant, churning cycles of anabolism and catabolism. This means that biochemists were left out of the rush for the earliest omes. Ten years later, they now have one of their own: the metabolome. In the field of neurodegenerative disease, metabolomics offers the hope of blood biomarkers and a better understanding of disease, and scientists are developing a serious appetite for it.
Metabolomics as a research discipline has been around since the 1970s, when biochemists profiled a few hundred metabolites at a time. The field is now coming into its own, with emerging technology capable of collecting and cataloguing the vast dataset encompassing every little metabolite in a particular tissue (read more on the methods of metabolomics in Part 2). The number of NIH-funded grants with the keyword “metabolome” has risen steadily from just one in 2002 to 55 in 2010, and PubMed articles with the same keyword have more than doubled recently, from 212 in 2008 to 517 in 2010.
However, this young field is still more promise than product at this point. The initial experiments merely give scientists a set of oft-unidentified metabolites. These discoveries tease researchers with tantalizing hints, but the following, time-consuming steps of actually identifying compounds and fitting them into biochemical pathways must occur before this research takes on any real meaning.
The central nervous system is poised to receive much of the early metabolomics attention. The psychiatry department at Duke University in Durham, North Carolina, is spearheading a multisite effort to collect and analyze metabolome data from neurological diseases (see Part 2). In the case of Alzheimer’s, scientists have conducted a handful of pilot studies that confirm that metabolism is altered in people with AD and mild cognitive impairment (MCI) (see Part 3). Scientists are also pursuing very early biomarker hunts with amyotrophic lateral sclerosis, Parkinson’s disease, and Huntington’s disease (see Part 4).
What, exactly, is in the metabolome? In short: everything that is not a gene, transcript, or protein. “At the end of the day, all of this has to translate into biochemistry and changes in metabolism,” said Rima Kaddurah-Daouk of Duke University, a leader in the field of metabolomics. “If you have a mutation in a gene, it is going to have an effect on your metabolism.” In addition, people’s metabolomes directly reflect their environment, from the foods they eat to the toxins they meet.
Although it is too early for complete consensus, scientists generally agree that the metabolome encompasses molecules smaller than 1,500-2,000 kilo Daltons in size. As for the size of the metabolome itself, scientists have no grip on that at all: Estimates vary from 2,000 to one million different metabolites. Some are not even of human origin—for example, microbes colonizing our bodies contribute their own small-molecule cocktail to the human system.
The National Institutes of Health invited metabolomics grant applications as a key part of its Roadmap in 2003 (Zerhouni, 2003). In 2004, Kaddurah-Daouk founded the Metabolomics Society to promote the field. The Society now has more than 500 members and publishes the journal Metabolomics.
Right now, doctors in clinical practice already observe some metabolites. But they can only probe a few limited markers—a test for cholesterol here, a measure of glucose or estrogen there, perhaps a standard Chem-7 or Chem-20 panel. It is akin to trying to understand a book by only reading a few torn-out pages. But metabolomics researchers envision a day when your annual blood workup will include panels of hundreds or thousands of molecules, painting a much more complete picture of health. This might allow doctors—with some computational assistance—to pick out signs of disease earlier, as well as predict which medicines will work best for an individual. Such tests would be a huge benefit in treating psychiatric diseases said Murali Doraiswamy, also of Duke, who collaborates with Kaddurah-Daouk. In these conditions, he noted, physicians currently use trial and error to find the best option among dozens of possible drugs, and this period can take months and be difficult for the patient.
Blood samples are source material for metabolomic studies to find disease signatures. Image credit: Wikimedia Commons
Metabolomic studies of neurological disease (reviewed in Kaddurah-Daouk and Krishnan, 2009) are already yielding potential biomarkers (see Part 3 and Part 4). Mikhail Bogdanov, of the Weill Cornell Medical College in New York City, told ARF he intends to soon publish data on metabolites that are common to Alzheimer’s, Parkinson’s, Huntington’s and ALS, as well as other metabolites that distinguish the four conditions. The researchers are still confirming that metabolites are linked to disease processes, not age or diet, but Bogdanov is confident they will be validated as disease markers. He declined to give ARF any hints, but said the markers would be new in the field of neurodegeneration. Moreover, scientists are finding metabolite patterns associated with neurodegeneration in blood plasma, which could save patients the trouble of a spinal tap.
In metabolomics, “could” and “might” remain the operative words. “We do not have biomarkers yet,” just “patterns,” Bogdanov said. “It is time to get to real structures.” Then, scientists will circle back to the genome, transcriptome, and proteome to get the big picture—in the über-ome that is systems biology.—Amber Dance.
The human body contains thousands of metabolites, and metabolomics scientists plan to measure them all (see Part 1). But how to do so remains rather an open question. “We are just starting to learn how to mine this rich dataset,” said Rima Kaddurah-Daouk of Duke University in Durham, North Carolina. That makes developing the right technology and software a big part of metabolomics research today.
Metabolomics is like a fishing expedition, said Murali Doraiswamy, who is also at Duke and collaborates with Kaddurah-Daouk on metabolomic biomarker projects. Scientists start by trawling for anything and everything they find, and net a glorious mess of spectrographic signals, each indicating a metabolite. Then, researchers narrow their focus to the individual swimmers. But at this point, many metabolites in a given experiment are unknown to science, so one of the main tasks at this stage is simply to identify the pieces. In the case of neurodegenerative disease, scientists have completed early pilot studies (see Part 3 and Part 4), but have plenty more work to do.
Part of the challenge is to get metabolomics scientists to agree on their fishing methods, said Jules Griffin of Cambridge University in the U.K. Without set protocols, one lab’s catch cannot be compared to another’s. Griffin and other researchers in the Metabolomics Standards Initiative are working to develop specific recommendations.
First, scientists must choose their fishing nets. “There is no single, one, uniform platform available,” said Mikhail Bogdanov of the Weill Cornell Medical College in New York City. The available options range from liquid and gas chromatography to mass spectrometry and nuclear magnetic resonance (NMR) spectroscopy to electrochemical detection; each will reveal a subset of the metabolome (reviewed in Kaddurah-Daouk et al., 2008). Techniques are often used in combination, and each has its advantages and disadvantages. For example, electrochemical detection is the most sensitive, Bogdanov said, but lacks the structural information NMR provides. These methods spit out long rows of peaks, and then scientists use statistics to crunch the data and pull out meaningful signals. The hope is to find a particular up-down-up-up-down pattern that defines a certain disease state, compared to controls.
Gas chromatograph supports one of several analysis methods in metabolomics research. Image credit: Wikimedia Commons
What tissue should scientists select as their fishing hole? For his animal studies, Griffin prefers brain tissue because it is the site of disease. But many scientists are pursuing cerebrospinal fluid (CSF), or debating the relative merits of plasma versus serum. Blood fluids, in particular, are easy to access, and the effects of nervous system changes often spill over into the periphery. For example, brain cells need a ready supply of glucose; if that supply is interrupted, the blood will likely show effects, too. “CSF is not always the best reflection of what is going on in the brain,” Bogdanov said. “Sometimes, in blood, we see more changes than in the CSF.” However, blood is also likely to include irrelevant information, ranging from what people had for lunch to their sleep habits. Another noninvasive option is to use imaging, since scientists already have the methods to visualize, for example, aspects of the brain’s glucose metabolism via positron emission tomography (see ARF related news story).
Then comes the time when scientists catalogue their catch. Several groups have started databases for this purpose. The Human Metabolome Project, at the University of Alberta in Edmonton, Canada, is a multimillion-dollar effort to build a freely accessible database of metabolites; it contains more than 7,900 so far (Wishart et al., 2007 and Wishart et al., 2009). In addition, the project is collecting physical samples of metabolites. Elsewhere, The Scripps Center For Metabolomics database comprises more than 40,000 entries. MassBank is a database of high-resolution mass spectra of metabolites hosted at Keio University, Tokyo, Japan. It includes more than 30,000 entries that researchers can scour. In the commercial world, Metabolon, Inc. (Ryals et al., 2007) in Research Triangle Park, North Carolina, has a database of more than 6,000 metabolites.
And what kinds of fish are in the nets, anyway? Just as the heat maps of transcriptomics or the 2-D gels of proteomics don’t mean all that much by themselves, those rows of peaks are only the beginning. “Just describing what is up and what is down does not cut it anymore,” Kaddurah-Daouk said. The fun truly begins when biochemists—faced with a peak indicating an unknown metabolite’s composition but not its molecular architecture—must figure out how the molecule is put together and give it a name. And then, they have to fit it into the body’s biochemical pathways to glean its full import.
Once the catch is in, tallied, and placed it its biochemical context, researchers hope that metabolomics plus pharmacology will lead to new treatments. They have already coined a mouthful of a name for the new ome: “pharmacometabolomics.” At Duke’s new Center for Pharmacometabolomics, Kaddurah-Daouk is building databases that cover metabolites in central nervous system diseases such as Alzheimer’s and schizophrenia. The center is uniting mathematicians, physicists, geneticists, and clinicians from many institutions, working together to determine metabolic indicators for people who do or do not respond to current drugs.
With those patterns in hand, scientists could predict drug response and select the proper treatment for an individual faster. It is a familiar promise—genomics and proteomics offer the same grand goals. Whether metabolomics will live up to its touted potential remains to be seen, Kaddurah-Daouk said: “This is hard work. It is work that takes time; it is not going to solve all of the problems quickly.”—Amber Dance.
Wishart DS, Tzur D, Knox C, Eisner R, Guo AC, Young N, Cheng D, Jewell K, Arndt D, Sawhney S, Fung C, Nikolai L, Lewis M, Coutouly MA, Forsythe I, Tang P, Shrivastava S, Jeroncic K, Stothard P, Amegbey G, Block D, Hau DD, Wagner J, Miniaci J, Clements M, Gebremedhin M, Guo N, Zhang Y, Duggan GE, Macinnis GD, Weljie AM, Dowlatabadi R, Bamforth F, Clive D, Greiner R, Li L, Marrie T, Sykes BD, Vogel HJ, Querengesser L.
HMDB: the Human Metabolome Database.
Nucleic Acids Res. 2007 Jan;35(Database issue):D521-6.
PubMed.
Wishart DS, Knox C, Guo AC, Eisner R, Young N, Gautam B, Hau DD, Psychogios N, Dong E, Bouatra S, Mandal R, Sinelnikov I, Xia J, Jia L, Cruz JA, Lim E, Sobsey CA, Shrivastava S, Huang P, Liu P, Fang L, Peng J, Fradette R, Cheng D, Tzur D, Clements M, Lewis A, De Souza A, Zuniga A, Dawe M, Xiong Y, Clive D, Greiner R, Nazyrova A, Shaykhutdinov R, Li L, Vogel HJ, Forsythe I.
HMDB: a knowledgebase for the human metabolome.
Nucleic Acids Res. 2009 Jan;37(Database issue):D603-10.
PubMed.
Ryals J, Lawton K, Stevens D, Milburn M.
Metabolon, Inc.
Pharmacogenomics. 2007 Jul;8(7):863-6.
PubMed.
Metabolomics: Metabolism and Omics in Alzheimer’s Disease
Metabolomics holds the promise of giant metabolite screens, leading to a bounty of clues to Alzheimer’s disease (see Part 1). Alzheimer’s researchers are certainly familiar with big science; the Alzheimer’s Disease Neuroimaging Initiative (ADNI) is entering its seventh year. Omics has played no small part in ADNI; indeed, the Initiative recently released data from a proteomics study. Metabolism has long been suspected in Alzheimer’s, with certain variants of the cholesterol-packer ApoE conferring risk, and abnormalities in glucose use showing up early in the brains of people at risk for AD. Researchers have conducted several pilot studies in metabolomics for Alzheimer’s and other neurodegenerative diseases (see Part 4). However, the methods of metabolomics (see Part 2) are not yet mature enough to partner with a large-scale study such as ADNI, said Bill Potter of Philadelphia, who chairs the Initiative’s proteomics working group.
Omics experiments require carefully standardized methods, Potter told ARF. “It has taken us much longer to agree on a reliable measure for proteomics than we thought it would,” he said. The proteomics data released by ADNI in November of 2010 include plasma analysis for 190 proteins already known to be related to AD or other diseases. Of course, some variation that appears to relate to AD or mild cognitive impairment (MCI) could also be due to age or gender. Potter is awaiting better methods before ADNI will prospect for unknown proteins. Similarly, he would like to see more groups validate metabolomics methods. “Metabolomics has huge downstream potential,” he said, but “there certainly is not yet agreement that the method is mature enough to make ADNI samples available.”
Although it is too soon to run such a large metabolomics study, scientists are pursuing several pilot projects. In an upcoming paper, Rima Kaddurah-Daouk of Duke University in Durham, North Carolina, and colleagues intend to report on metabolomic profiles of the cerebrospinal fluid (CSF) of 120 people with AD or MCI. They have measured a few hundred chemicals, Kaddurah-Daouk told ARF, and are searching for links with plaques, tangles, and disease severity. “It is going to be a nice, big matrix of the correlations,” she said.
That study is a follow-up on a previous, smaller project with postmortem material (Kaddurah-Daouk et al., 2010). The researchers measured 33 known metabolites in postmortem CSF samples from 15 people confirmed to have had Alzheimer’s disease and 15 non-demented controls. Norepinephrine levels were low in the AD subjects, and several other metabolic pathways showed differences as well. Of course, postmortem samples only reflect the final stages of disease; the new study should provide data on earlier phases.
Kaddurah-Daouk also expects soon to publish a study focused on lipids in AD. The lipidome can separate ApoE4 carriers from non-carriers, she told ARF. The scientists are still verifying their unpublished findings, but the work suggests that a given ApoE genotype comes with a unique lipidome signature.
In another preliminary study, Cristina Legido-Quigley of King’s College London, U.K., used liquid chromatography and mass spectrometry to analyze plasma from 16 people with AD, 12 with mild cognitive impairment (MCI), and 10 healthy controls (Greenberg et al., 2009). Many metabolites that show up in a screen such as this tend to be unknown. Even so, the researchers were able to identify three bile acids that were increased in MCI and AD samples, though the effect did not reach statistical significance. Glycocholic acid, glycodeoxycholic acid, and glycochenodeoxycholic acid are among the bile acids that help the body absorb fat and control cholesterol levels. Although those particular bile acids have not been linked to AD before, another type, tauroursodeoxycholic acid, has been proposed as a possible anti-apoptotic therapeutic (Ramalho et al., 2008).
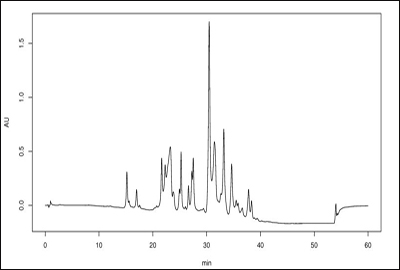
HPLC chromatograms line up peaks for each molecular component in a given mixture. (View larger image.) Image credit: Wikimedia Commons
Glycerophosphocholine, a precursor of the neurotransmitter acetylcholine, was another compound increased in AD samples. It has a long record in Alzheimer’s research: Levels are high in postmortem AD brains (Nitsch et al., 1992), and it has been previously reported as a potential CSF biomarker (Walter et al., 2004). In addition, the researchers observed that Alzheimer’s correlated with changes in D-glucosaminide, which is involved in sugar metabolism. If validated, it could become a new marker for AD.
In further studies, the researchers searched specifically for arachidonic acid, which has been suggested as an AD biomarker by the authors of a mouse study (Sanchez-Mejia et al., 2010). They found that the compound is boosted in the plasma of people with MCI, but not those with AD, differentiating the two, Legido-Quigley told ARF. In addition, the group is currently working on four molecules—of as-yet-unknown structure—that distinguish AD from controls with 99 percent accuracy, she told ARF. Legido-Quigley and her coauthors also noted that longitudinal studies are necessary, in particular to observe whether and when MCI morphs into AD.
Jules Griffin and colleagues at the University of Cambridge, U.K., used AD model mice to examine metabolomic changes in eight regions of the brain (Salek et al., 2010). Overall, they observed that affected animals evinced changes in certain amino acids and several molecules involved in fat or sugar metabolism. Griffin was particularly interested in the decrease in N-acetyl-L-aspartate (NAA) that the scientists observed in the sick mice. NAA’s function is not entirely clear, but neurons are chockfull of the stuff. Scientists suspect that it is involved in energy use, Griffin said, with well-fed neurons containing plenty of NAA, and sick or dying ones having less. The neurons in the AD mice “are having some problems in generating enough ATP for their processes, I suspect,” Griffin said. As one would expect from AD mice, the researchers observed metabolomic alterations in the hippocampus and cortex. They also noted changes in the cerebellum and midbrain, suggesting metabolism changes even in the regions not classically thought to be affected in AD.
“The thing that most interested me is, we were seeing metabolic changes before people were seeing changes in the histopathology,” Griffin said. “Before you actually see cell loss, you see metabolism being perturbed.” Imaging studies back up this assertion.
PET scans of glucose uptake are already regarded as a key marker for neural dysfunction in people with AD, and it might be an early marker at that (see ARF Webinar on Jack et al., 2010). For example, positron emission tomography (PET) scans show that glucose metabolism drops in ApoE4 carriers as early as their twenties and thirties (Reiman et al., 2004). The reduced glucose activity could indicate dysfunctional glucose metabolism or high activity at the synapses, said study author Eric Reiman, director of the Banner Alzheimer’s Institute in Phoenix, Arizona. Essentially, he said, the neurons “are wearing out the tread on their tires.” The researchers are following subjects longitudinally, looking for a link between glucose metabolism and future MCI or AD status. “We are pretty confident [glucose metabolism] is going to affect risk,” Reiman said, although he noted that the correlation only holds for groups, and may not predict decline in specific individuals.
More recently, Reiman’s group extended the genotype-glucose metabolism link to include Latino ApoE4 carriers in their fifties (Langbaum et al., 2010). In another study of postmortem tissue, young adult ApoE4 carriers evinced reduced mitochondrial activity in the brain, although they did not exhibit increases in amyloid-β or tau yet (Valla et al., 2010). “We think these mitochondrial changes might be some of the earliest changes you see with a predisposition to Alzheimer’s disease,” Reiman said.
The combination of imaging plus genomics, then, has proved to be a powerful pair (reviewed in Petrella et al., 2008). Could imaging be equally useful in metabolomics? Murali Doraiswamy of Duke University thinks it might, particularly with the adoption of nuclear magnetic resonance spectroscopy (MRS). “PET scans are limited in that they can only look at certain gross changes but cannot map detailed metabolite paths,” he wrote in an e-mail to ARF. When analyzing biochemical pathways by PET, he wrote, there are holes that the imaging cannot fill in, but MRS works with all kinds of markers. For example, MRS for hydrogen helps to differentiate AD from other dementias (Soher et al., 2005). “I think we are at a stage where it would be theoretically possible to use a combination of CSF metabolomics and PET/MRS to get to the bottom of this puzzle,” Doraiswamy wrote.
All these pilot experiments suggest that there is plenty of reason to study the metabolome in AD. The most exciting time in AD metabolomics is yet to come, Griffin said.—Amber Dance.
Metabolomics: Seeking Biomarkers for ALS, Parkinson’s, Huntington’s
Metabolomics—the sum of every small molecule linked to health or illness—is a young field (see Part 1 and Part 2), but it has already given researchers studying Alzheimer’s disease plenty to think about (see Part 3). Scientists studying other neurodegenerative diseases are also trawling metabolomes for biomarkers that would help make early diagnoses or assess drug effects. The Amyotrophic Lateral Sclerosis Association (ALSA) expects to release metabolomic data this year. In Parkinson’s disease, metabolomics has pointed to purine metabolism as a possible avenue of study. And early studies with Huntington’s link the disease to a broad catabolic phenotype. However, scientists need longitudinal results to really understand disease progression.
Analyzing ALS
The hunt for biomarkers in ALS has been ongoing for some time (see ARF related news story). Could as-yet-unknown metabolites help solve the problem? Rima Kaddurah-Daouk and colleagues at Metabolon, Inc., a company she founded in Research Triangle Park, North Carolina, went fishing for ALS-linked metabolites in a 2005 paper (Rozen et al., 2005). Kaddurah-Daouk is now running a Center for Metabolomics at Duke University in Durham, also in North Carolina.
The researchers used high-performance liquid chromatography (HPLC) to profile the plasma metabolomes of 28 people with motor neuron disease (MND) including ALS, and 30 healthy controls. The study authors found that 50 metabolites went up in people with MND, and even more were decreased, compared to control subjects. But many of those changes were apparently due to the drug riluzole—the only medicine specifically approved for ALS. When the scientists limited their study to people not taking riluzole, they found that six compounds went up with disease, and 70 down. Either way, the metabolome clearly differentiated people with MND from those without, suggesting metabolomic patterns are good markers for disease.
The researchers did not identify the metabolites associated with ALS. Metabolon is continuing this research, in collaboration with the ALSA, in a larger study of fluid samples from 650 people with MND. The study is ongoing, with some results expected this year, ALSA told ARF.
Probing Parkinson’s
In Parkinson’s, too, biomarkers are highly desirable. Mikhail Bogdanov of Weill Cornell Medical College in New York, who also participated in the ALS study, is leading similar efforts for PD in his lab. He and his colleagues knew oxidative stress could be important for Parkinson’s disease when they used liquid chromatography and electrochemical methods to examine plasma samples from 66 people with PD and 25 controls (Bogdanov et al., 2008). Thus, they took care to watch out for metabolites such as 8-OHdG, a marker for oxidative damage to DNA, and the antioxidants uric acid and glutathione. They observed that 8-OHdG and glutathione levels were high in people with PD, and uric acid concentrations were low, compared to controls. These results match with other studies showing that high uric acid correlates with decreased PD risk and slow disease progression (de Lau et al., 2005; also ARF related news story on Schwarzschild et al., 2008), and that glutathione levels are high in the substantia nigra of people who died of PD (Yohnes-Mhenni et al., 2007).
Previous reports also indicated that 8-OHdG is increased in the serum or urine of people with PD, but not enough to clearly distinguish patients and controls (Kikuchi et al., 2002 and Sato et al., 2005). In Bogdanov’s 2008 study, 8-OHdG levels alone were not enough to differentiate people with and without PD. But by mapping 1,860 metabolites—many unidentified—the researchers could clearly identify controls versus people with Parkinson’s. Currently, Bogdanov said, the researchers are working on the structures of some of those metabolites.
In a subsequent study, Bogdanov and colleagues were able to distinguish different types of Parkinson’s (Johansen et al., 2009). They compared plasma profiles from people with idiopathic PD and those whose disease was due to a mutation in LRRK2. Although the two PD categories shared much in common, the profile of a dozen mostly unknown metabolites was sufficient to distinguish them. Both kinds of PD were again linked to reductions in uric acid, the final product of protein metabolism, and several purine metabolites such as hypoxanthine and xanthine. Thus, the work suggests purines are involved in Parkinson’s. Indeed, the reduction in hypoxanthine was seen both in unmedicated people with PD and healthy carriers of LRRK2 mutations, but not in people undergoing treatment for Parkinson’s—suggesting that the medicines correct this anomaly. Bogdanov’s group is tracking their subjects longitudinally.
Hints to Huntington’s
Although the genetic cause of Huntington’s disease is easily assessed, clinicians need biomarkers to track progress. David Rubinzstein and colleagues at the Cambridge, U.K., Institute for Medical Research used gas chromatography and mass spectrometry to analyze serum from 20 control subjects and 30 people with the HD mutation—10 pre-symptomatic and 20 at an early stage of disease. They also worked with 10 non-transgenic and 19 HD model mice—10 sacrificed before symptoms started and nine sacrificed later to mimic the human study population (Underwood et al., 2006).
The scientists found that serum metabolomic profiles clearly differentiate HD model mice and their wild-type littermates; the trend in people is similar, though weaker. In particular, HD was linked to changes in concentrations of glycerol, monosaccharides, and the amino acid valine, indicating that the body’s metabolism of fats, carbohydrates, and proteins changes in HD. In the human samples, α-hydroxybutyric acid was also affected, hinting at changes to nucleic acid metabolism, too. Overall, the alterations suggest HD is associated with a catabolic phenotype; the work thus confirmed longstanding reports that catabolic changes in amino acid metabolism happen before symptoms start (Reilmann et al., 1995). The catabolic processes may help explain why people with Huntington’s are often underweight (Djouse et al., 2002). In a further study, Cambridge scientists used calorimetric experiments to show that people and mice with HD do indeed have a negative energy balance (Goodman et al., 2008).
These markers could help doctors evaluate treatments meant to slow symptom onset. The researchers are still working in the validation stage, Rubinzstein told ARF. In addition, he said, they are following the subjects longitudinally to examine the rate of change on metabolomic markers.—Amber Dance.


Comments
No Available Comments
Make a Comment
To make a comment you must login or register.