ARIAS: Zooming in On Eye-based Biomarkers for Alzheimer’s
Quick Links
Have biomarkers for preclinical Alzheimer’s disease been staring us in the face all along, and we just did not see them? Recent studies report a plethora of changes in the eye as Aβ pathology emerges in the brain. Dwindling retinal blood flow, thinning retinal nerve fibers, and retinal Aβ plaques themselves are but a few of the features scientists have proffered as readily detectable AD biomarkers. As disparate studies mount, so does the need for consensus. Thus far, there is little independent confirmation, much less agreement on what works. Peter Snyder of the University of Rhode Island, Providence, is trying to change that. At the AD/PD meeting in Lisbon, Snyder announced an initiative to compare eye-based measures head-to-head, and longitudinally, in people across the disease continuum. If his effort confirms eye-based tests as bona fide AD biomarkers, they could become frontline screens that could be deployed around the world.
- Lots of little studies hint that the eye undergoes changes in the preclinical stage of AD.
- The planned Atlas of Retinal Imaging Study seeks to anoint a gold standard.
- Will optometrists screen for people at risk of cognitive decline?
“For those of us doing research in this field, the dream is that universal and regular vision care with retinal imaging could serve to both preserve physical/social functioning in older adults and detect early signs of cognitive disease,” wrote Alison Abraham of Johns Hopkins School of Medicine in Baltimore.
“Eye-based screening could have a meaningful role in future studies of preclinical Alzheimer’s disease even in an era when we have high hopes for fluid and imaging biomarkers,” noted Pierre Tariot of the Banner Alzheimer’s Institute in Phoenix.
Studies have linked numerous eye changes to AD or cognitive impairment. Many focus on the retina, a disc of nervous tissue at the back of the eye that connects to the brain via the optic nerve. PubMed lists around 100 studies published in the past three years about the retina and AD. For example, the retina can be visualized with ocular coherence tomography. Opthalmologists and optometrists use OCT to identify glaucoma or macular degeneration, and angiography recently has been tacked on to add blood flow measurements. This is called OCT-A.

Zoom in on AD? A peripapillary OCT scan images a region (green circle) of the retina surrounding the entrance to the optic nerve. The analysis renders a linearized image in which each retinal layer can be measured. [Courtesy of Peter Snyder.]
Researchers use OCT to detect Aβ plaques in the retina and attempt to correlate them with cortical Aβ accumulation as per PET scans (Jul 2014 conference news; Sep 2017 news). Others link retinal capillaries to AD. For example, one study reported that the inner fovea—an avascular zone in the middle of the retina where visual acuity is highest—was thinner and wider in cognitively normal people with a positive amyloid PET scan (Aug 2018 news). Another claimed slower blood flow and fewer vessels in the surrounding parafoveal region in people with mild cognitive impairment (Zhang et al., 2019). Using photography, a study found double the odds of mild cognitive impairment or dementia in people whose retina had hemorrhaged than in people without such bleeds (Lee et al., 2019).

Synaptic Sandwich. The retina comprises 10 layers, including eight depicted here. Three neuronal layers (GCL, INL, and OPL) are connected via synaptic layers (IPL, OPL). The retinal nerve fiber layer (RNFL) projects axons into the optic nerve. [Courtesy of Peter Snyder.]
The structure of the retina itself is also implicated in AD. It consists of 10 layers, including three neuronal cell layers sandwiched on either side by synaptic and axonal layers. Studies have come to conflicting conclusions about how the thickness of each layer correlates with AD. Some report that people with AD have fewer ganglion cells—the neurons project their axons into the optic nerve like hairs pulled into a ponytail. Others report a thinner retinal nerve fiber layer (RFNL), which contains those optic nerve-bound axons; alas, it’s unclear exactly where along the retina the RNFL thins, if at all (Danesh-Meyer et al., 2006; Cheung et al., 2015; Garcia-Martin et al., 2016). The list of single-study biomarker suggestions goes on (for review, see Chan et al., 2018).
At AD/PD, Snyder reviewed his own data of one of the few longitudinal studies thus far to examine the relationship between multiple retinal measures and preclinical AD (Santos et al., 2018). He also presented unpublished findings from the same cohort. The researchers enrolled 63 people with a family history of AD who were cognitively normal but reported subjective memory complaints. They measured numerous retinal markers in them at baseline and 27 months later, at which time participants had an Aβ-PET scan. Santos et al. spotted a correlation between a person’s Aβ accumulation and thinning of the RNFL in their macula, a pigmented region near the retina’s center. In Lisbon, Snyder added an analysis of macular pigment optical density (MPOD), a measure of pigment within the macula. Using a combination of lasers to detect pigment, Snyder found that reduced pigment correlated with slippage on cognitive tests, but not with Aβ deposition.
Enter ARIAS
Snyder likened the current landscape of eye-based biomarkers to the pre-ADNI days of neuroimaging. Given the jumble of small studies reporting on a group’s “favorite” single marker, Snyder decided to kick off a larger, longer cohort to track multiple candidate markers across the disease spectrum. Called Atlas of Retinal Imaging in Alzheimer’s Study, ARIAS aims to amass a reference database of retinal changes that track with disease (see clinicaltrials.gov). To be funded by Florida’s BayCare Health System, ARIAS will recruit participants from two hospitals in Tampa, Florida, and from one in Rhode Island.
ARIAS seeks 330 participants aged 55 to 80, from cognitively normal people deemed at low or high risk for AD based on family history and ApoE4 status, to people with mild cognitive impairment or mild AD. They will undergo annual eye exams for three years, at which investigators will use OCT and OCT-A to measure the thickness of every retinal layer, blood vessel volume and flow, and macular pigment. They will assess the pupil’s response to light, and sensitivity to contrast, a visual marker that wanes in AD. A subset of participants will wear actigraphy monitors for two weeks to gauge their physical activity and sleep patterns, as connections between the eye and the brain are known to affect sleep. Amyloid PET scans are not in the protocol, but Snyder said many participants have already had one as part of the Imaging Dementia–Evidence for Amyloid Screening (IDEAS) study (see clinicaltrials.gov), and that data can go into ARIAS analyses.
“This longitudinal study in well-characterized (preclinical) AD cases provides a great step forward for retinal imaging as possible biomarker in AD,” commented Jurre den Haan and Philip Scheltens of VU University Medical Center (see full comment below). Longitudinal retinal imaging data from preclinical AD cases from the European Medical Information Framework (EMIF)-AD cohort will soon be published.
Carol Cheung of the Chinese University of Hong Kong believes ARIAS will fill a knowledge gap in the field. Interpreting retinal parameters is tricky because they can be affected by aging, diseases such as hypertension and diabetes, eye size, glaucoma, and other neurological conditions including multiple sclerosis and stroke. “It is likely that AD-related changes in retinal vasculature and neuronal structure present as a spectrum of variants due to involvement of multiple variables,” she wrote.
Maya Koronyo-Hamaoui of Cedars-Sinai Medical Center in Los Angeles agreed that studies such as ARIAS were highly needed to find eye-based biomarkers that could facilitate early AD detection and monitoring of progression. “Moreover, there is a great need to correlate these nonspecific changes in retinal vascular biomarkers and atrophy with retinal AD-characteristic signs (amyloid beta and tauopathy) in these patients,” she added.
Logistical Hurdles
Snyder hopes results from ARIAS will form the foundation for a future toolkit of eye-based biomarkers that can be used as a frontline screening tool for preclinical AD. A person who tests positive for eye-based markers could be referred to a neurologist for more standard biomarker tests. OCT tests could theoretically be run in primary care clinics, but Snyder said that adding one more test to the already packed to-do list of these physicians might not be easy. Opthalmologists also have a loaded schedule and perform a variety of procedures. Optometrists, he said, are more likely to welcome Alzheimer screening into their standard care. Not only do they have fewer tests to run on their patients, they may also see AD screening as a way to ensure a steady client base, Snyder said. OCT scanners are cheaper and more widely available around the world than PET scanners.
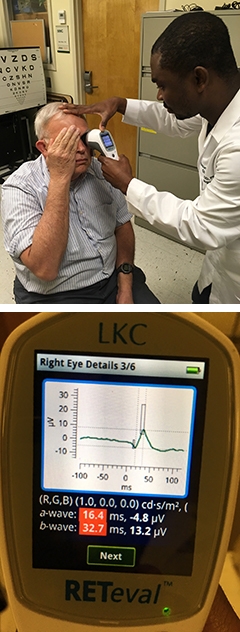
Biomarker by Hand? A handheld electroretinogram (ERG) measures the response of retinal neurons to light, without touching or dilating the eye (left). An ERG signal from the device screen shows a loss of the photopic negative response in a person with MCI (right). [Courtesy of Edmund Arthur and Delia Cabrera DeBuc, University of Miami.] [Courtesy of Edmund Arthur and Delia Cabrera DeBuc, University of Miami.]
That said, Delia Cabrera DeBuc of the University of Miami pointed toward even cheaper tools. Last December, she reported that retinal neurons are hypoactive in people with cognitive impairment. She uses a handheld electroretinogram (ERG, see Cabrera DeBuc et al., 2018). The device costs less than $15,000, requires no dilation or manipulation of the eye, and is easier to use than an OCT scanner, which costs around $100,000, Cabrera DeBuc said.
Even with an electroretinogram, Cabrera has seen pushback in primary care settings, where nurses and doctors are crammed for time. She agrees that optometrists’ offices might be a venue for AD screening using OCT, though patients without insurance for vision care would have to pay out of pocket to receive tests there. Therefore, incorporating eye-based AD screening tests into the primary care reimbursement structure would be key to their widespread use, Cabrera DeBuc said. She thinks ARIAS is on the right track, because any retinal AD markers that emerge from it will motivate the health care field to implement screening into primary care.
Snyder is hosting an open workshop May 22–23 in Washington, D.C., where researchers can discuss new data and challenges in the field of retinal imaging, and hash out a way forward. Register by clicking here.
Beyond AD
Eye-based biomarkers could hold promise for detecting other neurodegenerative diseases as well. One study found thinning in the retina’s outer photoreceptor layer in people with frontotemporal dementia (FTD) (Kim et al., 2017). This month, Benjamin Kim at the University of Pennsylvania in Philadelphia and colleagues published longitudinal findings from the same cohort. The outer retina continued to diminish, but only in FTD patients predicted to have underlying tau pathology (Kim et al., 2019). This is distinct from the inner layer thinning observed in AD. “This suggests that OCT may help to distinguish FTD from AD. We currently are enrolling patients in an OCT study to directly compare these two groups,” Kim wrote to Alzforum.
Retinal thinning in the rTg4510 mouse model of tauopathy suggests that changes in the eye reflect tau pathology in the brain (Harrison et al., 2019). Retinal changes have also been reported in people with amyotrophic lateral sclerosis (Volpe et al., 2015).—Jessica Shugart
References
News Citations
- Alzheimer’s Disease: In the Eye of the Patient?
- Retinal Plaques May Enable Noninvasive Screening for AD
- Does Retinal Thinning Reflect Early Alzheimer’s?
Research Models Citations
Paper Citations
- Zhang YS, Zhou N, Knoll BM, Samra S, Ward MR, Weintraub S, Fawzi AA. Parafoveal vessel loss and correlation between peripapillary vessel density and cognitive performance in amnestic mild cognitive impairment and early Alzheimer's Disease on optical coherence tomography angiography. PLoS One. 2019;14(4):e0214685. Epub 2019 Apr 2 PubMed.
- Lee MJ, Deal JA, Ramulu PY, Sharrett AR, Abraham AG. Prevalence of Retinal Signs and Association With Cognitive Status: The ARIC Neurocognitive Study. J Am Geriatr Soc. 2019 Jun;67(6):1197-1203. Epub 2019 Feb 1 PubMed.
- Danesh-Meyer HV, Birch H, Ku JY, Carroll S, Gamble G. Reduction of optic nerve fibers in patients with Alzheimer disease identified by laser imaging. Neurology. 2006 Nov 28;67(10):1852-4. PubMed.
- Cheung CY, Ong YT, Hilal S, Ikram MK, Low S, Ong YL, Venketasubramanian N, Yap P, Seow D, Chen CL, Wong TY. Retinal ganglion cell analysis using high-definition optical coherence tomography in patients with mild cognitive impairment and Alzheimer's disease. J Alzheimers Dis. 2015;45(1):45-56. PubMed.
- Garcia-Martin E, Bambo MP, Marques ML, Satue M, Otin S, Larrosa JM, Polo V, Pablo LE. Ganglion cell layer measurements correlate with disease severity in patients with Alzheimer's disease. Acta Ophthalmol. 2016 Feb 19; PubMed.
- Chan VT, Sun Z, Tang S, Chen LJ, Wong A, Tham CC, Wong TY, Chen C, Ikram MK, Whitson HE, Lad EM, Mok VC, Cheung CY. Spectral-Domain OCT Measurements in Alzheimer's Disease: A Systematic Review and Meta-analysis. Ophthalmology. 2018 Aug 13; PubMed.
- Santos CY, Johnson LN, Sinoff SE, Festa EK, Heindel WC, Snyder PJ. Change in retinal structural anatomy during the preclinical stage of Alzheimer's disease. Alzheimers Dement (Amst). 2018;10:196-209. Epub 2018 Feb 7 PubMed.
- Cabrera DeBuc D, Somfai GM, Arthur E, Kostic M, Oropesa S, Mendoza Santiesteban C. Investigating Multimodal Diagnostic Eye Biomarkers of Cognitive Impairment by Measuring Vascular and Neurogenic Changes in the Retina. Front Physiol. 2018;9:1721. Epub 2018 Dec 6 PubMed.
- Kim BJ, Irwin DJ, Song D, Daniel E, Leveque JD, Raquib AR, Pan W, Ying GS, Aleman TS, Dunaief JL, Grossman M. Optical coherence tomography identifies outer retina thinning in frontotemporal degeneration. Neurology. 2017 Oct 10;89(15):1604-1611. Epub 2017 Sep 8 PubMed.
- Kim BJ, Grossman M, Song D, Saludades S, Pan W, Dominguez-Perez S, Dunaief JL, Aleman TS, Ying GS, Irwin DJ. Persistent and Progressive Outer Retina Thinning in Frontotemporal Degeneration. Front Neurosci. 2019;13:298. Epub 2019 Apr 4 PubMed.
- Harrison IF, Whitaker R, Bertelli PM, O'Callaghan JM, Csincsik L, Bocchetta M, Ma D, Fisher A, Ahmed Z, Murray TK, O'Neill MJ, Rohrer JD, Lythgoe MF, Lengyel I. Optic nerve thinning and neurosensory retinal degeneration in the rTg4510 mouse model of frontotemporal dementia. Acta Neuropathol Commun. 2019 Jan 7;7(1):4. PubMed.
- Volpe NJ, Simonett J, Fawzi AA, Siddique T. Ophthalmic Manifestations of Amyotrophic Lateral Sclerosis (An American Ophthalmological Society Thesis). Trans Am Ophthalmol Soc. 2015;113:T12-1-15. PubMed.
External Citations
Further Reading
Papers
- Thomson KL, Yeo JM, Waddell B, Cameron JR, Pal S. A systematic review and meta-analysis of retinal nerve fiber layer change in dementia, using optical coherence tomography. Alzheimers Dement (Amst). 2015 Jun;1(2):136-43. Epub 2015 Apr 23 PubMed.
- den Haan J, Balk LJ, Verbraak FD. Ganglion cell layer measurements correlate with disease severity in patients with Alzheimer's disease. Acta Ophthalmol. 2018 Mar;96(2):e265-e266. Epub 2017 Aug 22 PubMed.
- Snyder PJ, Johnson LN, Lim YY, Santos CY, Alber J, Maruff P, Fernández B. Nonvascular retinal imaging markers of preclinical Alzheimer's disease. Alzheimers Dement (Amst). 2016;4:169-178. Epub 2016 Oct 1 PubMed.
Annotate
To make an annotation you must Login or Register.
Comments
Johns Hopkins School of Medicine
There are lots of challenges before we will reach the point of a viable screening tool—and that’s really the goal. Retinal measures are not needed to diagnose AD. Once clinical symptoms arise, it is far too late to intervene. Rather, the hope is to use the retina as a harbinger of future cognitive impairment. Can we see changes in the retinal neuronal layer thickness or the perfusion of the retina at some point early in the disease process during which we believe damage is occurring but individual cognitive reserve is compensating?
The challenges include questions of measurement—few studies have looked at the variability in OCT measurements in population samples over time and across platforms, segmentation algorithms, etc. The signal may be there but if it is subsumed by noise, we won’t be able to find it. As the technology improves for newer modalities like OCT angiography, noise should go down.
A second question is feasibility particularly for OC-angiography, which is a new tool not currently used clinically. In a recent study, 22 percent of images were excluded for poor image quality. We are seeing similar issues with artifacts including motion, media opacity, blink lines, low signal strength, etc.—all things that affect measurement of retinal parameters. We need to determine if the individuals in whom we can’t get good images are actually the ones in whom we most want images, i.e. the reasons why the images are poor—poorer health, pain, inability to fixate on the target, cataractThe challenges include questions of measurement – few studies have looked at the variability in OCT measurements in population samples over time and across platforms, segmentation algorithms, etc. The signal may be there but if it is subsumed by noise, we won’t be able to find it. As the technology improves for newer modalities like OCT angiography, noise should go down.
A second question is feasibility particularly for OC-angiography, which is a new tool not currently used clinically. In a recent study, 22% of images were excluded for poor image quality. We are seeing similar issues with artifacts including motion, media opacity, blink lines, low signal strength, etc—all things that affect measurement of retinal parameters. We need to determine if the individuals in whom we can’t get good images are actually the ones in whom we most want images, i.e. the reasons why the images are poor – poorer health, pain, inability to fixate on the target, cataractThe challenges include questions of measurement – few studies have looked at the variability in OCT measurements in population samples over time and across platforms, segmentation algorithms, etc. The signal may be there but if it is subsumed by noise, we won’t be able to find it. As the technology improves for newer modalities like OCT angiography, noise should go down.
A second question is feasibility particularly for OC-angiography, which is a new tool not currently used clinically. In a recent study, 22 percent of images were excluded for poor image quality. We are seeing similar issues with artifacts including motion, media opacity, blink lines, low signal strength, etc.—all things that affect measurement of retinal parameters. We need to determine if the individuals in whom we can’t get good images are actually the ones in whom we most want images, i.e. the reasons why the images are poor—poorer health, pain, inability to fixate on the target, cataract—may be correlated with higher risk of cognitive impairment. If you can only image the healthy individuals, this would be a poor screening tool.
Lastly, there are questions of utility. There is a growing body of data suggesting these changes in the retina exist in AD patients and MCI patients, but do they exist early enough to allow us to intervene?
What OCT has going for it is that it is noninvasive, theoretically quick to perform, and could drive older adults to vision care, which would be good for maintaining functionality in age. For those of us doing research in this field, the dream is that universal and regular vision care with retinal imaging could serve to both preserve physical/social functioning in older adults and detect early signs of cognitive disease. That would be a game-changer in our quest toward healthier aging may be correlated with higher risk of cognitive impairment. If you can only image the healthy individuals, this would be a poor screening tool.
Lastly, there are questions of utility. There is a growing body of data suggesting these changes in the retina exist in AD patients and MCI patients, but do they exist early enough to allow us to intervene?
University of Pennsylvania
It is very important to investigate retinal imaging biomarkers for FTD, given the overlap in clinical presentations between FTD and AD. In our studies (Kim et al., 2017; Kim et al., 2019) we have seen outer retina, i.e. the photoreceptor layer, thinning in FTD patients. We did not see the inner retina, i.e. the retinal nerve fiber and ganglion cell layers, thinning that is typically found in AD. This suggests that OCT may help to distinguish FTD from AD. We currently are enrolling patients in an OCT study to directly compare these two groups. Our data suggests that not all neurodegenerative processes lead to inner retina thinning, and thus some neurodegenerative diseases with specific brain pathology may also have specific retina pathology.
References:
Kim BJ, Irwin DJ, Song D, Daniel E, Leveque JD, Raquib AR, Pan W, Ying GS, Aleman TS, Dunaief JL, Grossman M. Optical coherence tomography identifies outer retina thinning in frontotemporal degeneration. Neurology. 2017 Oct 10;89(15):1604-1611. Epub 2017 Sep 8 PubMed.
Kim BJ, Grossman M, Song D, Saludades S, Pan W, Dominguez-Perez S, Dunaief JL, Aleman TS, Ying GS, Irwin DJ. Persistent and Progressive Outer Retina Thinning in Frontotemporal Degeneration. Front Neurosci. 2019;13:298. Epub 2019 Apr 4 PubMed.
VU University Medical Center
This longitudinal study in well-characterized (preclinical) AD cases (ARIAS) provides a great step forward for retinal imaging as a possible biomarker in AD. Despite promising reports on different types of retinal imaging in AD (neurodegeneration, vascular, amyloid/tau), the jury is still out on deciding which retinal biomarker could be useful in the clinic at what AD disease stage. Previous literature showed that the use of cross-sectional retinal thickness measurements with OCT as a biomarker in AD forms a challenge. While several studies report retinal thinning in AD cases, others showed no group differences in a large cohort (Sánchez et al., 2018).
Our two individual studies involving well-characterized AD cases from the Amsterdam Dementia Cohort and University College London didn’t show group differences in retinal thickness measurements (unpublished data) as well. Similarly, in the EMIF-AD cohort, cross-sectional OCT measurements in preclinical AD cases did not show group differences compared to amyloid-negative participants (Kreeke et al., ACTA Ophthalmologica, in press). A joint effort using a meta-analyses approach on individual data could help provide answers to the question of whether cross-sectional retinal thickness measurements with OCT could provide a marker for retinal neurodegeneration in AD. Using such an approach, important confounders, such as age, could be taken into account on a participant level, rather than what we did on a study level in our previous work (den Haan et al., 2017).
The role of longitudinal OCT in preclinical AD is interestingly pointed out by Snyder and colleagues as recently presented during the AD/PD conference in Lisbon (Santos et al., 2018). Test-retest variability of OCT should be considered in this population, however, given generally small effect sizes reported. In addition, one could argue that a biomarker that needs multiple measurements over several years might not be practical in clinic. All things considered, longitudinal data from preclinical AD cases from the EMIF-AD cohort, with lead author Aleid van de Kreeke, are on the way to confirm these interesting findings.
The use of comparable study protocols in well-characterized cases, comparing retinal biomarkers with currently used biomarkers for neurodegeneration, amyloid, and tau, is key to answer which retinal biomarker could be useful at what disease stage. The workshop on retinal imaging in neurodegenerative disease on May 22 and 23 in Washington, D.C., will be instrumental to discuss steps forward. We would be keen on discussing recommendations for future research there and publish these recommendations together for future reference.
Specific molecular imaging using state-of-the art techniques and analyses methods could yield new retinal biomarkers in AD. Future research from our team will be focused on molecular, wide-field, and spectral retinal imaging. So eyes on the future!
On behalf of the I-READ team, Alzheimer Center Amsterdam
References:
Sánchez D, Castilla-Marti M, Rodríguez-Gómez O, Valero S, Piferrer A, Martínez G, Martínez J, Serra J, Moreno-Grau S, Hernández-Olasagarre B, De Rojas I, Hernández I, Abdelnour C, Rosende-Roca M, Vargas L, Mauleón A, Santos-Santos MA, Alegret M, Ortega G, Espinosa A, Pérez-Cordón A, Sanabria Á, Ciudin A, Simó R, Hernández C, Villaoslada P, Ruiz A, Tàrraga L, Boada M. Usefulness of peripapillary nerve fiber layer thickness assessed by optical coherence tomography as a biomarker for Alzheimer's disease. Sci Rep. 2018 Nov 5;8(1):16345. PubMed.
den Haan J, Verbraak FD, Visser PJ, Bouwman FH. Retinal thickness in Alzheimer's disease: A systematic review and meta-analysis. Alzheimers Dement (Amst). 2017;6:162-170. Epub 2017 Jan 25 PubMed.
Santos CY, Johnson LN, Sinoff SE, Festa EK, Heindel WC, Snyder PJ. Change in retinal structural anatomy during the preclinical stage of Alzheimer's disease. Alzheimers Dement (Amst). 2018;10:196-209. Epub 2018 Feb 7 PubMed.
The Chinese University of Hong Kong
The retina, as an extension of central nervous system (CNS), offers a unique “window” to study cerebral microvascular and neurodegenerative damage in the brain. Advances in retinal imaging provide opportunities to image the retina easily. The retina can now be visualized, quantified and monitored noninvasively using state-of-the-art imaging, including quantitative vascular imaging and optical coherence tomography (OCT). Over the past decade, different groups have made significant progress in developing and applying retinal imaging as a noninvasive biomarker test to study microvascular and neuronal pathology in the eye and in the brain, particular in Alzheimer’s disease (AD).
Although retinal imaging is a promising tool for identifying AD-associated retinal characteristics, questions and knowledge gaps remain in this area of research that limit its translation for AD identification:
First, the vast majority of studies are cross-sectional, of limited sample size, or evaluate only a single retinal imaging technology modality (e.g., retinal photographs or early generation OCT).
Second, the strength of the associations between retinal imaging parameters with AD is relatively modest.
Third, to date, current available software programs for measuring retinal vascular imaging parameters are not fully automated, and manual input, even following a standardized protocol, introduces variability in retinal measurements.
Fourth, the currently defined parameters can be affected by individual variations such as aging, systemic disease (e.g. hypertension and diabetes), ocular conditions (e.g. axial length, media opacity, glaucoma) and other neurological conditions (e.g. multiple sclerosis, and stroke). Since the associations between retinal changes and AD have remained statistically significant while adjusting for these confounders, it is likely that AD-related changes in retinal vasculature and neuronal structure present as a spectrum of variants due to involvement of multiple variables (i.e. confounding factors).
The ARIAS study would address some of the above gaps by its longitudinal prospective study design. Hopefully, the ARIAS study would lead us to enhance the use of retinal imaging techniques in predicting who will develop AD or disease progression in AD as well as deeper understanding of early vascular dysfunction and neuronal injury in the pathophysiology of AD.
References:
Cheung CY, Chan VT, Mok VC, Chen C, Wong TY. Potential retinal biomarkers for dementia: what is new?. Curr Opin Neurol. 2019 Feb;32(1):82-91. PubMed.
Cheung CY, Ikram MK, Chen C, Wong TY. Imaging retina to study dementia and stroke. Prog Retin Eye Res. 2017 Mar;57:89-107. Epub 2017 Jan 3 PubMed.
Cheung CY, Ong YT, Hilal S, Ikram MK, Low S, Ong YL, Venketasubramanian N, Yap P, Seow D, Chen CL, Wong TY. Retinal ganglion cell analysis using high-definition optical coherence tomography in patients with mild cognitive impairment and Alzheimer's disease. J Alzheimers Dis. 2015;45(1):45-56. PubMed.
Cheung CY, Ong YT, Ikram MK, Ong SY, Li X, Hilal S, Catindig JA, Venketasubramanian N, Yap P, Seow D, Chen CP, Wong TY. Microvascular network alterations in the retina of patients with Alzheimer's disease. Alzheimers Dement. 2014 Mar;10(2):135-42. Epub 2014 Jan 15 PubMed.
Make a Comment
To make a comment you must login or register.