Behold, Plaques Mapped in Whole Brain at High Resolution
Quick Links
Take this, James Webb. The light from a billion parsecs away may help us understand the big bang, but fluorescence from thousands of amyloid plaques in the brain may help us figure out something closer to home—the birth of amyloid plaques. Specifically, two recent papers describe advances in optical microscopy that trace plaques and their surrounding structures in whole brain in exquisite detail.
- Ex vivo microscopy details the structural milieu of amyloid plaques.
- In vivo optoacoustic microscopy scans whole brain for plaques.
- Individual plaques detected at 8-micron resolution.
In the July 14 Nature Biomedical Engineering, scientists led by Jan Klohs and Daniel Razansky at the University of Zurich describe how large-field multifocal fluorescence and a combination of optical and acoustic imaging—yes, you heard that correctly—can map plaques across the brains of living mice, including deep into the hippocampus and thalamus. At below 150-micron resolution, their methods knock the pants off PET. Meanwhile, scientists led by Xianzhen Yin, Shanghai Institute of Materia Medica, reported a method to simultaneously map plaques and other structures at submicron resolution across the whole mouse brain postmortem. Their analysis appeared last April in Frontiers in Neuroscience.

A Galaxy of Plaques. Micro-optical sectioning tomography shows distribution of plaques across the whole brain of a 5xFAD mouse. [Courtesy of Yin et al., Front Neurosci, 2022.]
Yin and colleagues, led by senior authors Haiyan Zhang, Zhaobing Gao, and Hualiang Jiang, claim that their approach “opens a door to routine systematic studies of complex interactions among brain components in mouse models of Alzheimer’s disease.” The scientists used micro-optical sectioning tomography (MOST) to simultaneously image plaques, cells, blood vessels, neuronal processes, and nerve tracts without the need for specific labels.
MOST had been used previously to image these entities individually, but Yin customized the image processing methodology, capitalizing on differences in transmitted light intensity from ultrathin Nissl stained sections, aka gray values, to identify specific structures by their morphology (see image below).
In 5xFAD mice, the scientists identified entities they dubbed “pompons.” They had a dark core surrounded by a pale halo, and were absent in wild-type mice. The pompons turned out to be amyloid plaques, as judged by thioflavin-T fluorescence and immunohistochemistry.

MOST Observant Microscopy. Processing micro-optical tomography images from a section of 5xFAD mouse hippocampus identifies nerve processes (blue arrow), blood vessels (red arrow), amyloid plaques—aka pompons (cyan arrow) and somata (purple arrow). Bottom shows a representative two-dimensional scan across the section marked by the yellow line. [Courtesy of Yin et al., Front Neurosci, 2022.]
Using MOST, the scientists rendered the brain in three dimensions, allowing them to study plaques and their surrounding structures at high resolution. Plaques were densest where the brain was packed with cell bodies, such as the deep cortical layers, the entorhinal cortex and subiculum, and the stratum oriens of the cornu ammonis, which encompasses the CA1 to CA4 regions of the hippocampus. The researchers noticed that where there were plaques, neuronal processes appeared thinned out, and were nearly absent where the plaque burden was particularly heavy. For example, in the subiculum, neuronal processes were dramatically fewer (see image below). Processes passing through or near plaques were deformed, often bent, or ended abruptly.

Plaque or Process. Neuronal processes in the hippocampi of wild-type mice (top) break down in 5xFAD mice (middle), as Aβ plaques elbow themselves into the cell layers (bottom). [Courtesy of Yin et al., Front Neurosci, 2022.]
Likewise, MOST revealed scant blood vessels in the vicinity of dense plaque fields, suggesting profound disruption of the vasculature (see image below). As with neuronal processes, vessels were distorted or terminated abruptly. Plaques in regions with the highest density of cell and blood vessels tended to have holes and bulges. In contrast, plaques in less dense areas of the brain appeared more solid and smooth.

Plaques and Vessels. In the hippocampus, the density of plaques (green) correlated with thinning of blood vessels (red). Click for movie. [Courtesy of Yin et al., Front Neurosci, 2022.]
All told, the method paints a high-resolution panorama of structures in the brain that associate with plaques. The authors believe it will help scientists better understand anatomical changes that occur in AD.
Listening to Plaques?
MOST gives a snapshot of one point in time in postmortem tissue. Klohs and colleagues used a different approach, albeit one that goes by a similar acronym, to identify plaques in real time in living mice. Volumetric multispectral optoacoustic tomography, or vMSOT (not vMOST), allowed these scientists to capture fluorescence across the entire mouse brain at a resolution of 150 μm.
Optoacoustics is akin to “listening” to molecules reflecting light. It detects ultrasound waves generated when nanosecond laser pulses shine through tissue. The sound signals scatter less than the light does, allowing the source to be pinpointed with greater resolution. Measuring at different wavelengths of light allows even more structural information to be gleaned.

Listen to Those Plaques. By combining large-field multifocal laser fluorescence with an optoacoustic transducer (left), scientists image whole-brain plaque load at high resolution (right). [Courtesy of Ni et al., Nat. Biomed. Eng., 2022.]
First authors Ruiqing Ni, Zhenyue Chen, and Xosé Luís Deán-Ben and colleagues combined vMSOT with fluorescence of AOI987, an oxazine dye derivative that binds amyloid plaques. AOI987 absorbs far red light, unlike hemoglobin, all but eliminating interference from blood vessels, a common problem with this type of microscopy.
Ni and colleagues tested the system with APP/PS1 and ArcAβ mice (see image below). The former had plaques only in the cortex, while in the latter, plaques packed the cortex, hippocampus, and thalamus. Plaques were resolved below 150 microns and mapped to brain regions using a reference MRI atlas of the mouse brain.
Using serial measures from the same animal over time taught the scientists that 14-month-old ArcAβ mice accumulated 30 percent more amyloid in a single month.

Watch It Live. Optoacoustic fluorescence microscopy captured plaque distribution in the brains of APP/PS1 (left) and ArcAβ (right) models of amyloidosis. [Courtesy of Ni et al., Nat. Biomed. Eng., 2022.]
To image individual plaques, the scientists turned to a slightly different type of microscopy. They optimized a technique called large-field multifocal illumination (LMI). This capitalizes on the optoacoustic device's ability to scan for light split by a grating. In this case, a 21 x 21 mini-beam grid enabled Klohs and colleagues to scan a 14 x 14 mm2 field of view, at a spatial resolution of 8 microns.
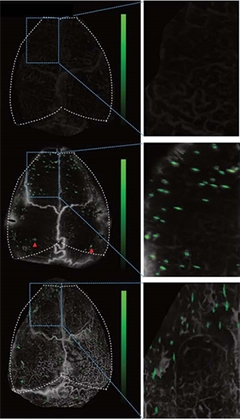
One Plaque at a Time. In vivo, optoacoustic LMI imaging of APP/PS1 (middle) and ArcAβ mice (bottom) identified individual plaques (right) in the cortex. Wild-type mice (top) show no signal. [Courtesy of Ni et al., Nat. Biomed. Eng., 2022.]
Unlike the volumetric optoacoustics (OA), LMI can’t penetrate deep into the brain. Even so, measuring fluorescence of HS-169, a luminescent conjugated oligothiophene (LCO) dye that binds Aβ fibrils, LMI resolved individual plaques in the cortex in vivo (see image below). Plaques were about 40 microns across in both APP/PS1 and ArcAβ mice.
"The combination of high-resolution LMI fluorescence and volumetric OA imaging methodologies introduced in this work allows for transcranial observation of Aβ deposits in mouse models of AD across different scales, and may thus have substantial impact on investigations into this disease,” concluded the authors.
One option might be to study different types of Aβ oligomers in vivo. A plethora of LCOs have been synthesized that bind with different affinities to different “strains” of Aβ (Aug 2017 news). These could be imaged in the same or across different mice.
This might help scientists figure out why mouse models sometimes respond unevenly to experimental treatments. “The ability to differentiate strain-specific patterns is expected to shed light on the question of how strain variability influences the differences in drug responses observed across different studies,” noted the authors.—Tom Fagan
References
Research Models Citations
News Citations
External Citations
Further Reading
Papers
- Ni R, Chen Z, Gerez JA, Shi G, Zhou Q, Riek R, Nilsson KP, Razansky D, Klohs J. Detection of cerebral tauopathy in P301L mice using high-resolution large-field multifocal illumination fluorescence microscopy. Biomed Opt Express. 2020 Sep 1;11(9):4989-5002. Epub 2020 Aug 11 PubMed.
Primary Papers
- Yin X, Zhang X, Zhang J, Yang W, Sun X, Zhang H, Gao Z, Jiang H. High-Resolution Digital Panorama of Multiple Structures in Whole Brain of Alzheimer's Disease Mice. Front Neurosci. 2022;16:870520. Epub 2022 Apr 19 PubMed.
- Ni R, Chen Z, Deán-Ben XL, Voigt FF, Kirschenbaum D, Shi G, Villois A, Zhou Q, Crimi A, Arosio P, Nitsch RM, Nilsson KP, Aguzzi A, Helmchen F, Klohs J, Razansky D. Multiscale optical and optoacoustic imaging of amyloid-β deposits in mice. Nat Biomed Eng. 2022 Sep;6(9):1031-1044. Epub 2022 Jul 14 PubMed.
Annotate
To make an annotation you must Login or Register.
Comments
No Available Comments
Make a Comment
To make a comment you must login or register.