Add to ADNI: Imaging Amyloid and Analyzing the Genome
Quick Links
Typically, a large investment in big science attracts ideas on how to get more bang for the buck once the original study is on its way. Likewise, ADNI evolved from its original design. For one, the original biomarker protocol changed when the investigators realized they had underestimated the participants’ willingness to undergo a lumbar puncture. More than half did, as opposed to the expected one-fifth. A privately funded extension now ensures that CSF biochemistry gets done not only for baseline and year 1, but also at year 2 and 3 visits. This completes the longitudinal dataset available for each person. Moreover, the same funders encouraged a biomarker qualification study to certify the performance of the CSF biomarker assay. That study subsequently established that the way the assay was performed actually yielded reproducible and reasonably identical results in different laboratories (Shaw et al., submitted). A pathology substudy was added to validate the participant’s diagnosis and round off the dataset on each person. Aficionados can download protocols and related information on these studies at ADNI’s add-on studies page.
For another, ADNI expanded to include amyloid imaging and genomics. Chet Mathis of the University of Pittsburgh School of Medicine heads the 11C PIB-PET substudy, with quality control going through the hands of Robert Koeppe at the University of Michigan, Ann Arbor. It has enrolled 106 participants who receive annual PIB scans either twice or three times, depending on their diagnosis and on when they joined. To date, baseline PIB scans on 101 of them (19 controls, 63 people with MCI, and 19 with AD) are uploaded on the LONI website; the remaining handful will go up this month. The participating sites are currently collecting year 1 follow-up scans; 37 of those are available at LONI already. About 47 percent of controls, 60 percent of MCI cases, and 90 percent of AD cases are PIB positive.
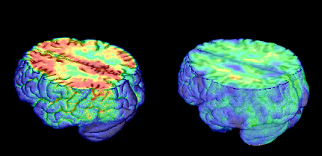
Here are PET images taken using Pittsburgh compound B that measure β amyloid accumulation. The are superimposed on MRI scans. The AD patient shows uptake of tracer throughout cortex, the control shows only non-specific white matter binding. Image credit: William Jagust
For this study, too, a complete comparison with functional PET imaging and MRI won’t be possible until all data are in. Here are the tentative insights from the data available so far: longitudinal data from ADNI, as well as from other centers such as the Karolinska group in Uppsala, Sweden, and the Austin Health Center in Melbourne, Australia, all agree that PIB retention in PIB-positive controls, MCI, and AD cases changes little from year to year. “Amyloid deposition is apparently a slow process that occurs over a decade or more,” commented Mathis. This confirms prior speculation based on postmortem studies.
ADNI data are beginning to show that FDG-PET is a more sensitive indicator of longitudinal change for AD than is amyloid PET. For mild MCI and especially the normal controls, the story is different. At those earliest stages, amyloid PET may be more sensitive than FDG-PET. That said, its link to cognitive decline remains to be firmly established, and on this issue amyloid imaging may benefit from combination with FDG-PET, Bill Jagust of UC Berkeley said at the International Conference on Alzheimer’s Disease (ICAD), held last July in Chicago.
How to interpret amyloid imaging data at these early stages is an area of active discussion. Different labs are working out how to decide whether a given person is “PIB positive” or “PIB negative” based on his or her scan. This is not trivial because amyloid deposition in the brain is a continuum. Wherever one draws the line, people just below the line have about the same amount of amyloid in their brains as people just above the line. The cutoff is artificial, but for practical purposes scientists sometimes have to place participants into those “positive” and “negative” boxes. Several approaches developed at Pittsburgh, Austin, UC Berkeley, and Washington University all roughly agree despite their quantitative differences, Mathis noted (see ARF related news story and Aizenstein et al., Amyloid deposition is frequent and often is not associated with significant cognitive impairment in the elderly, Archives of Neurology, in press).
Mathis emphasized, however, that the average PIB-positive controls look nothing like the average PIB-positive AD cases. PIB-positive controls have much less PIB retention than people with AD. “This is important to keep in mind,” he wrote to ARF. “One PIB-positive control in the ADNI data set looks very AD-like, but that subject is an exception. Focusing on that one control image is misleading of the PIB-positive control group as a whole.” The average PIB-positive MCI case, by contrast, looks similar to the average PIB-positive AD patient.
The other major add-on study focuses on the genomes of the 821 study participants. After ADNI got going in 2005, its principal investigator, Mike Weiner of UCSF, appointed geneticists from around the country to a working group led by Andrew Saykin at Indiana University in Indianapolis. Its charge was to ramp up ADNI’s originally modest design for ApoE testing and DNA preservation to a full genomewide analysis. This study aims to exploit the datasets of clinical, neuropsychology, imaging, and biomarker data in the same set of people in order to detect genetic variants that can explain some of the findings in those domains. For example, the search is on for genetic variants associated with the rate of progression of AD as measured by global and regional atrophy, or by metabolic changes, or genetic correlates of cognitive profiles and fluid markers. Besides informing early detection methods, this kind of data can also provide a foundation for future pharmacogenetic trials.
The working group selected a genotyping platform, planned data analyses, and secured funding through the Foundation of NIH. About a year ago, the genotyping study started up. It uses Illumina 610 Quad arrays, whose 620,901 markers, including SNPs, MCH markers, and copy number variants cover 90 percent of the human genome. According to Saykin, the genotyping itself is nearly done. “We anticipate that this will be entirely finished and quality control and basic analysis completed by the end of the year,” he wrote to ARF. A partial dataset—some three quarters of the samples with first-pass quality control—will go up on LONI this month. Eventually, the full data will become available on the NIH dbGaP website.
This is the first step. The second—analyzing this genetic data relative to the coming avalanche of neuroimaging and other phenotype data—is only just beginning. It will last beyond the arrival of the year 2 and 3 data, Saykin noted. And it’s complicated business. The data involved—multiple sets, each of them large—post tremendous computational and intellectual challenges. Imagine mapping more than 600,000 features and hundreds of thousands of voxels of MRI data per person, to pick just one example. To tame this data storm and draw meaning from it, the genetics working group has formed a set of multidisciplinary teams of imagers, neuroscientists, geneticists, computer scientists, and biostatisticians at several sites. It’s too early to ask for solid data. In the way of teasers, suffice it to say that Saykin’s group took a first crack at analyzing an available subset of data by examining genetic variants within Lars Bertram and colleagues’ Top AlzGene Results. According to Saykin, even just that first peek revealed some striking associations between known candidate genes, hippocampal volume, and gray matter density. But because the data are preliminary, he stayed mum for now on what those are.—Gabrielle Strobel.
This is Part 4 of a six-part series. See also Parts 1, 2, 3, 5, 6. Read the entire series [.pdf].
References
News Citations
- HAI Chicago: PIB in Healthy People
- As ADNI Turns Four, $64 Million Data Start Rolling In
- ADNI Results: A Story of Standardization and Science
- More ADNI Results 2: It’s All About Power
- Bumps Along the Way—ADNI’s Snafus
- Worldwide ADNIs: Other Nations Follow Suit
Other Citations
External Citations
Further Reading
Annotate
To make an annotation you must Login or Register.
Comments
No Available Comments
Make a Comment
To make a comment you must login or register.